School district enrollment levels have dramatically shifted in Pennsylvania over the past 25 years, writes Kevin McCorry in a fascinating report for NewsWorks that reveals the inequity of the state’s school-funding formula for the last quarter-century.
More than a third of the state’s 500 districts have either grown or shrank by more than 25 percent since 1991.
That was the year the state implemented a “hold harmless” policy, which dictated that enrollment fluctuations would not affect state funding allocations.
So, for decades, all districts received the same inflationary boost to funding, regardless of whether they gained or lost hundreds of students from year to year.
“Hold harmless” has been a major boon for districts where student population has declined (mostly in western Pennsylvania), and has been a major challenge for many of the districts where enrollment has spiked (mostly in southeastern Pennsylvania).
Every school district in Montgomery County has seen an increase in student population in the past 25 years.
The following is a breakdown of those changes. Included at left is where each school district ranks in the state, in terms of student population growth. Each district’s percentage of growth is in parentheses:
- Perkiomen Valley (147 percent)
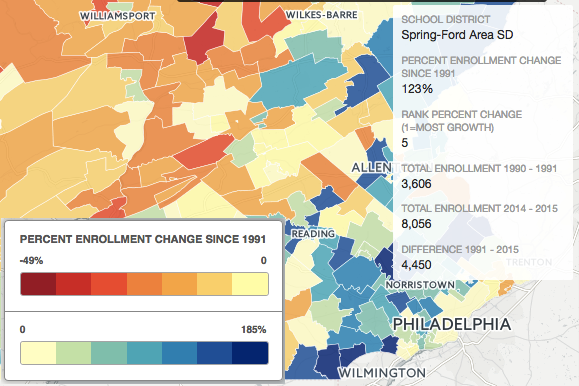
- Spring-Ford Area (123 percent)
- Methacton (58 percent)
- Lower Merion (55 percent)
- Lower Moreland Township (50 percent)
- Hatboro-Horsham (41 percent)
- Souderton Area (39 percent)
- Jenkintown (35 percent)
- Springfield Township (33 percent)
- Abington (32 percent)
- Upper Merion Area (31 percent)
- Wissahickon (29 percent)
- Norristown (28 percent)
- Colonial (26 percent)
- Upper Dublin (25 percent)
- North Penn (24 percent)
- Pottsgrove (20 percent)
- Cheltenham Township (14 percent)
- Pottstown (13 percent)
- Upper Moreland Township (7 percent)
- Upper Perkiomen (2 percent)
The Garnet Valley School District in Delaware County ranked No. 1 in Pennsylvania, having grown 185 percent since 1991.
The effects of “hold harmless” have been felt well beyond the classroom, too, as the policy has created a strong correlation between enrollment shifts and property taxes.
Without requisite aid increases tied to enrollment gains, many growing districts have been pushed to raise local taxes at higher and faster rates — a major challenge, especially for property-poor districts.
Click here to read more from NewsWorks about the population change in each of Pennsylvania’s school districts and its ripple effect.